Behind the Score
Every FSA risk score is built from Canadian government datasets, validated against 17 years of IBC/CatIQ insured loss data (national aggregate, all lines), and derived through a published weighting model. No proprietary feeds. No black boxes.
01
The Score
How Risk Is Scored Across Four Perils Using Open Government Data.
IntelliWhere scores every Canadian postal code area on flood, hail, wildfire, and winter storm exposure. Then combines them into a single composite using Simple Additive Weighting (SAW) with Analytic Hierarchy Process (AHP)-derived weights. The steps below walk through the method exactly, including a live calculation for FSA T9H.
1
We add risk factors together
Each FSA gets scored on four climate threats: flood, hail, wildfire, and winter storm. Those four scores are combined into one composite number through Simple Additive Weighting (SAW), a method that multiplies each score by its importance and adds them up.
2
Each threat is given a different weight
Not all perils cost insurers equally. Flooding drives far more insured losses across Canada than winter storms, so it carries more influence in the final score. The weights are: Flood 38% · Hail 27% · Wildfire 23% · Winter Storm 12%.
3
Weights were calculated, not guessed
Using the Analytic Hierarchy Process (AHP), a structured method that derives weights by comparing every pair of threats head-to-head. Is flood worse than hail? By how much? Those comparisons are converted mathematically into the final percentages.
4
Weights were validated against real loss data
The AHP judgments were cross-checked against 17 years of IBC/CatIQ insured loss data (2005–2022, national aggregate, all lines). If flooding consistently drives the largest share of claims in Canada, it should carry the most weight, and our model confirms it does.
5
The weight matrix passes a formal consistency test
AHP utilizes a self-check called the Saaty Consistency Ratio (CR). It verifies that our comparisons don't contradict each other. If flood outranks hail and hail outranks wildfire, then flood must also outrank wildfire. Our CR = 0.017, below the 0.10 acceptance threshold.
The weights at a glance
Flood
38%
Hail
27%
Wildfire
23%
Winter Storm
12%
Weight vs. Canadian insured loss share — IBC / CatIQ 2005–2022 · Four-peril share (flood / hail / wildfire / winter)
Our AHP weight
IBC/CatIQ loss share
Our weights align with loss shares for flood and hail. The wildfire weight (23%) sits below its raw loss share due to single-event concentration — the 2016 Fort McMurray wildfire alone represents ~25% of the four-peril total, making any share derived from this window an event-sample artefact as much as a climatological signal. The winter storm weight (12%) sits above its 2005–2022 share, reflecting tail risk evidenced by the 1998 ice storm outside the derivation window.
Source: IBC / CatIQ national insured loss data · All lines of business · National aggregate · Derivation period: 2005–2022 · Loss shares are shares of four-peril losses only (excludes wind-primary events and earthquake) · Derivation: docs/ibc_loss_share_derivation.md.
Note: all-lines aggregate may understate hail's property-specific loss share relative to personal property lines.
Here is how IntelliWhere scores FSA T9H — Fort McMurray, Alberta — one of the highest-risk FSAs in Canada.
Step 1 — Raw peril scores (from government data)
| Flood | 1.79 | |
| Hail | 2.49 | |
| Wildfire | 4.00 | maximum possible score |
| Winter Storm | 1.70 |
What drives each score
Flood 1.79 AB FHIP floodplain coverage limited for T9H boundary; post-1980 housing stock reduces urban vulnerability layer
Hail 2.49 ICHD v1.1, 2005–2024: 15 events recorded; v2 percentile renorm anchors score against national p1–p99 distribution
Wildfire 4.00 2016 Horse River Fire (~590,000 ha, 2,400+ structures); CWFIS fire density at maximum; FWI at data ceiling (23.44)
Winter 1.70 ECCC 30-yr climate normals: cold baseline, no dominant ice-storm or freezing-rain event concentration
Step 2 — Multiply each score by its AHP weight
| Flood | 1.79 | × | 0.38 | = | 0.680 | |
| Hail | 2.49 | × | 0.27 | = | 0.672 | |
| Wildfire | 4.00 | × | 0.23 | = | 0.920 | Dominant peril — wildfire at maximum severity |
| Winter Storm | 1.70 | × | 0.12 | = | 0.204 |
Step 3 — Sum the weighted scores
0.680 + 0.672 + 0.920 + 0.204 = 2.476 (inputs shown rounded to 2 decimal places; composite computed and stored at full precision: 2.4776)
Step 4 — Composite score
2.4776
MODERATE
Regional Peril Lens
AB + wildfire ≥ 3.0
→ Critical
→ Critical
See Section 03 below →
Score = 0.38 × Flood + 0.27 × Hail + 0.23 × Wildfire + 0.12 × Winter Storm · Output: 1.00 – 4.00 · CR = 0.017
Consistency Ratio 0.017 — below the 0.10
acceptance threshold.
Score uncertainty. Each composite carries a propagated ±0.03 uncertainty at 1σ (Taylor first-order, independent perils). FSAs where the flood score is based on the housing-age proxy rather than floodplain geometry carry wider true uncertainty — the proxy introduces systematic error that geometry-based scoring does not. Score confidence intervals are on the roadmap for PDF reports as a Phase 1 quick win.
02
The Four Perils
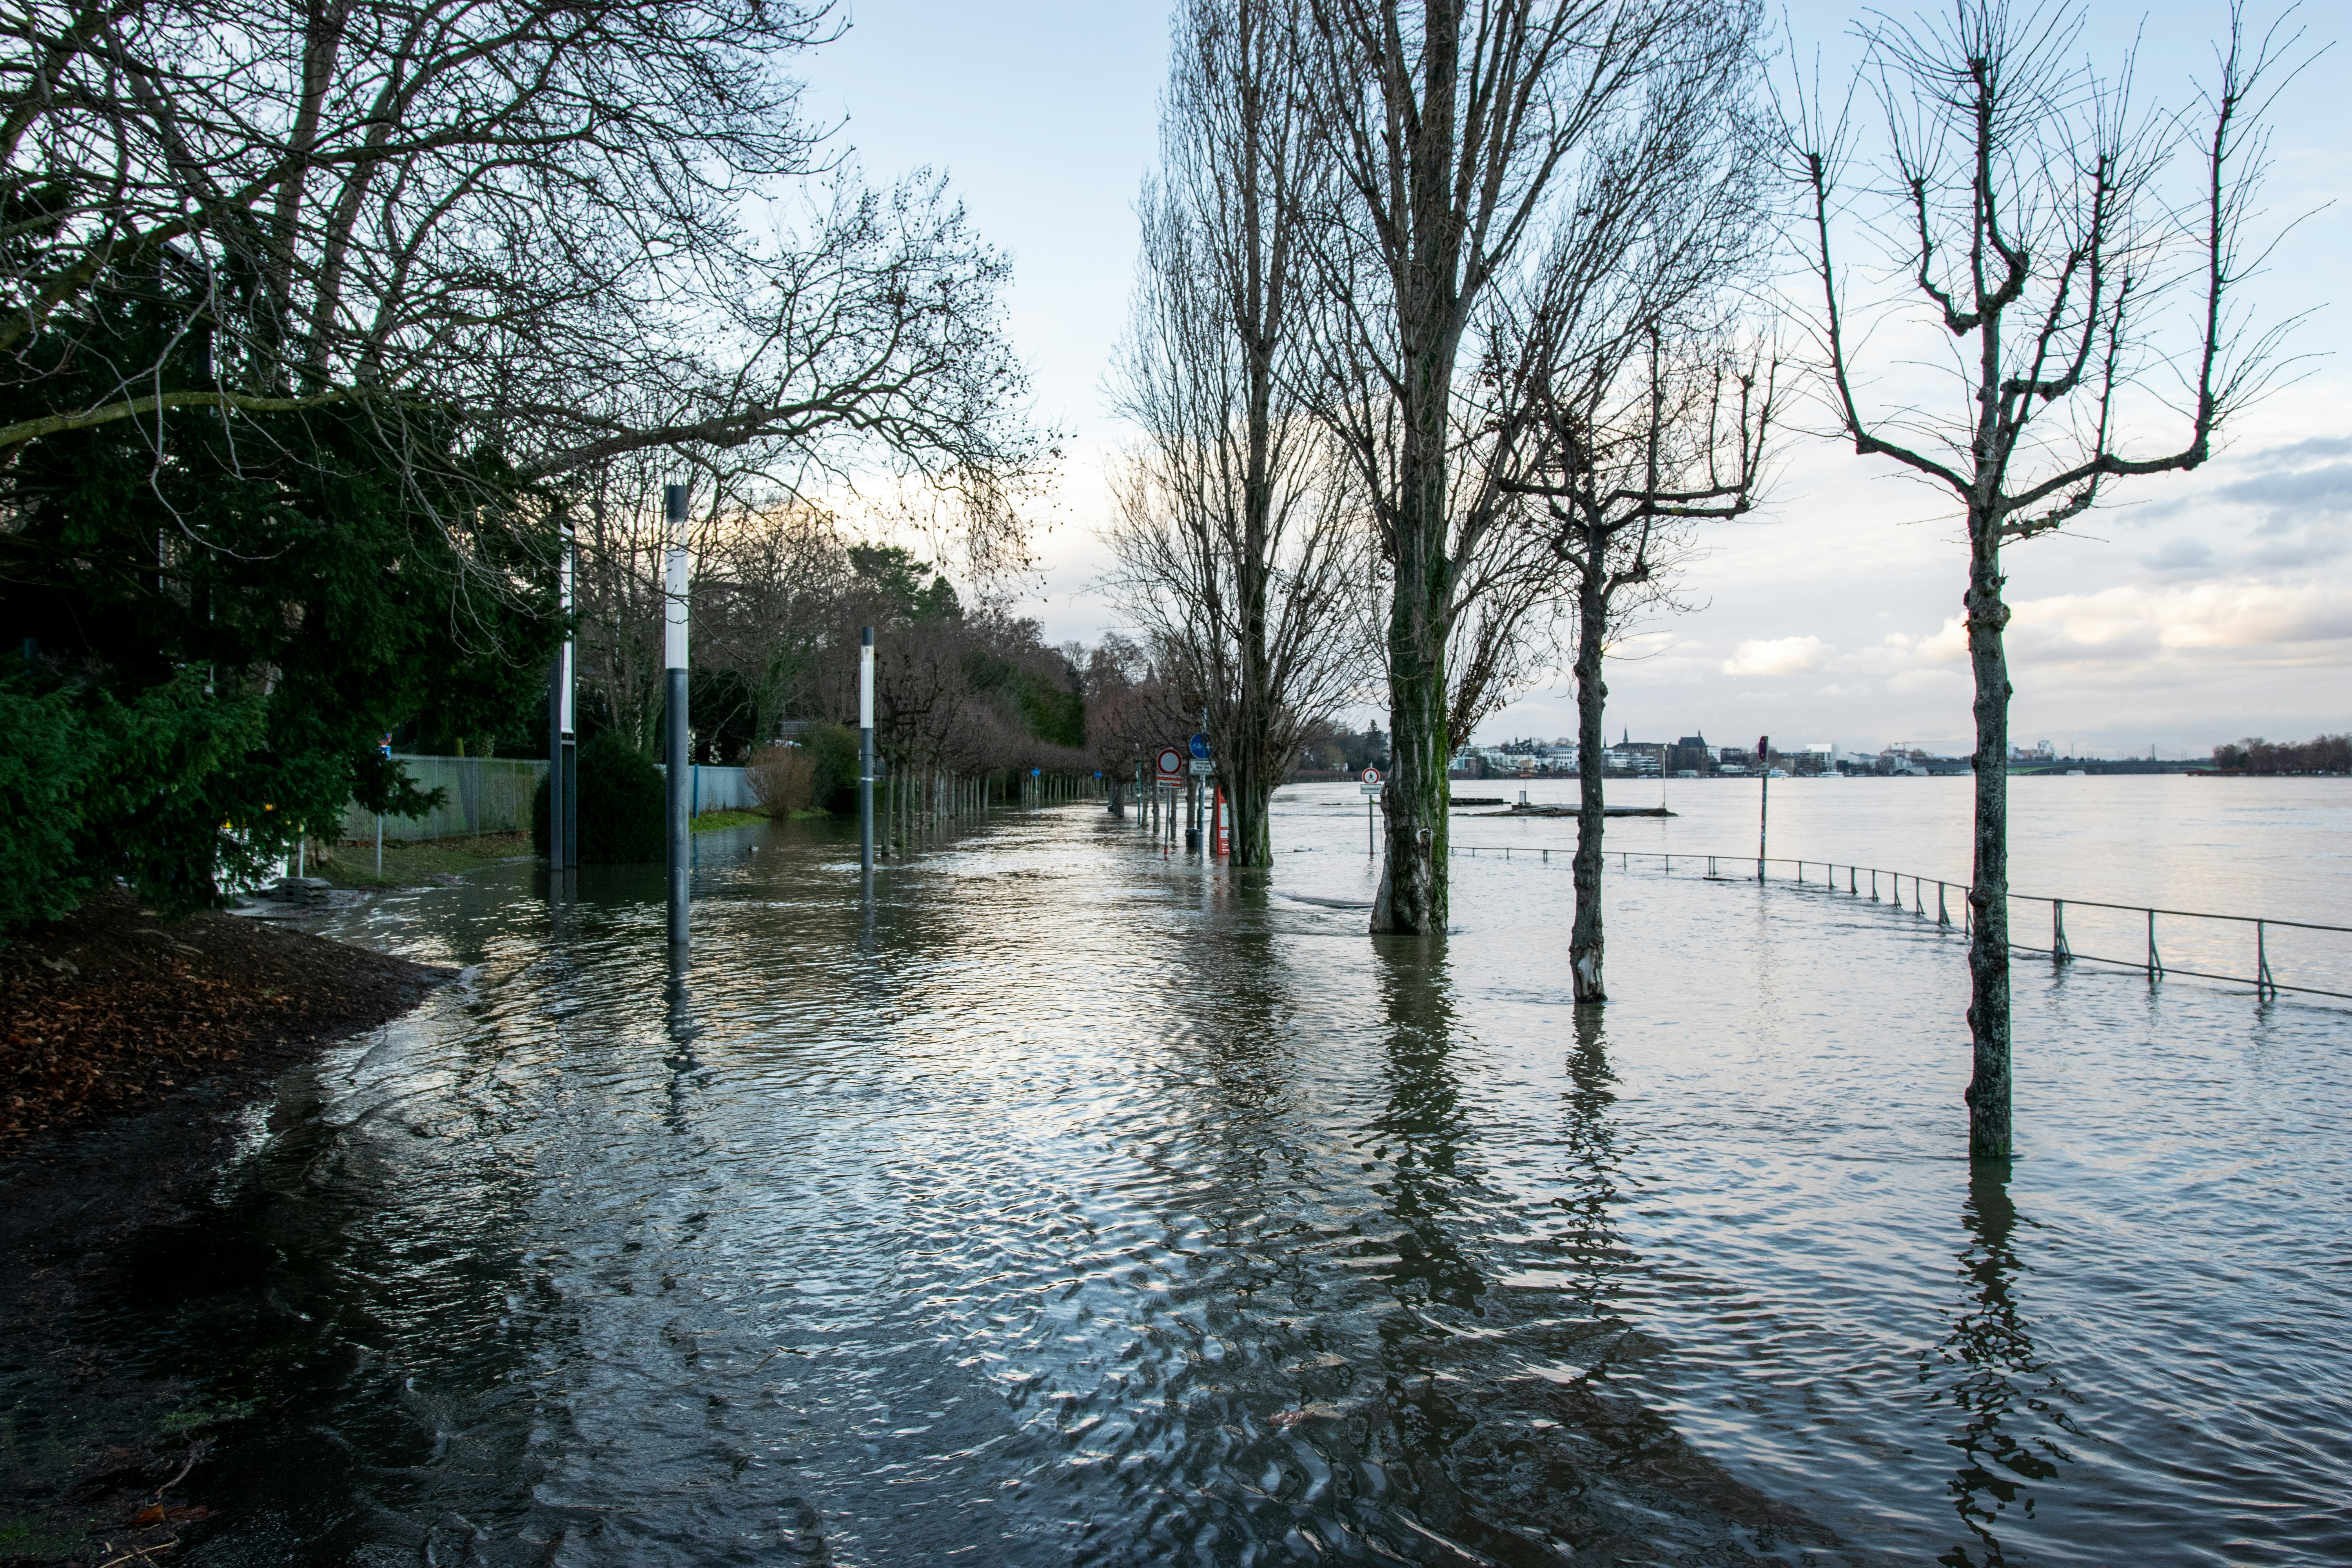
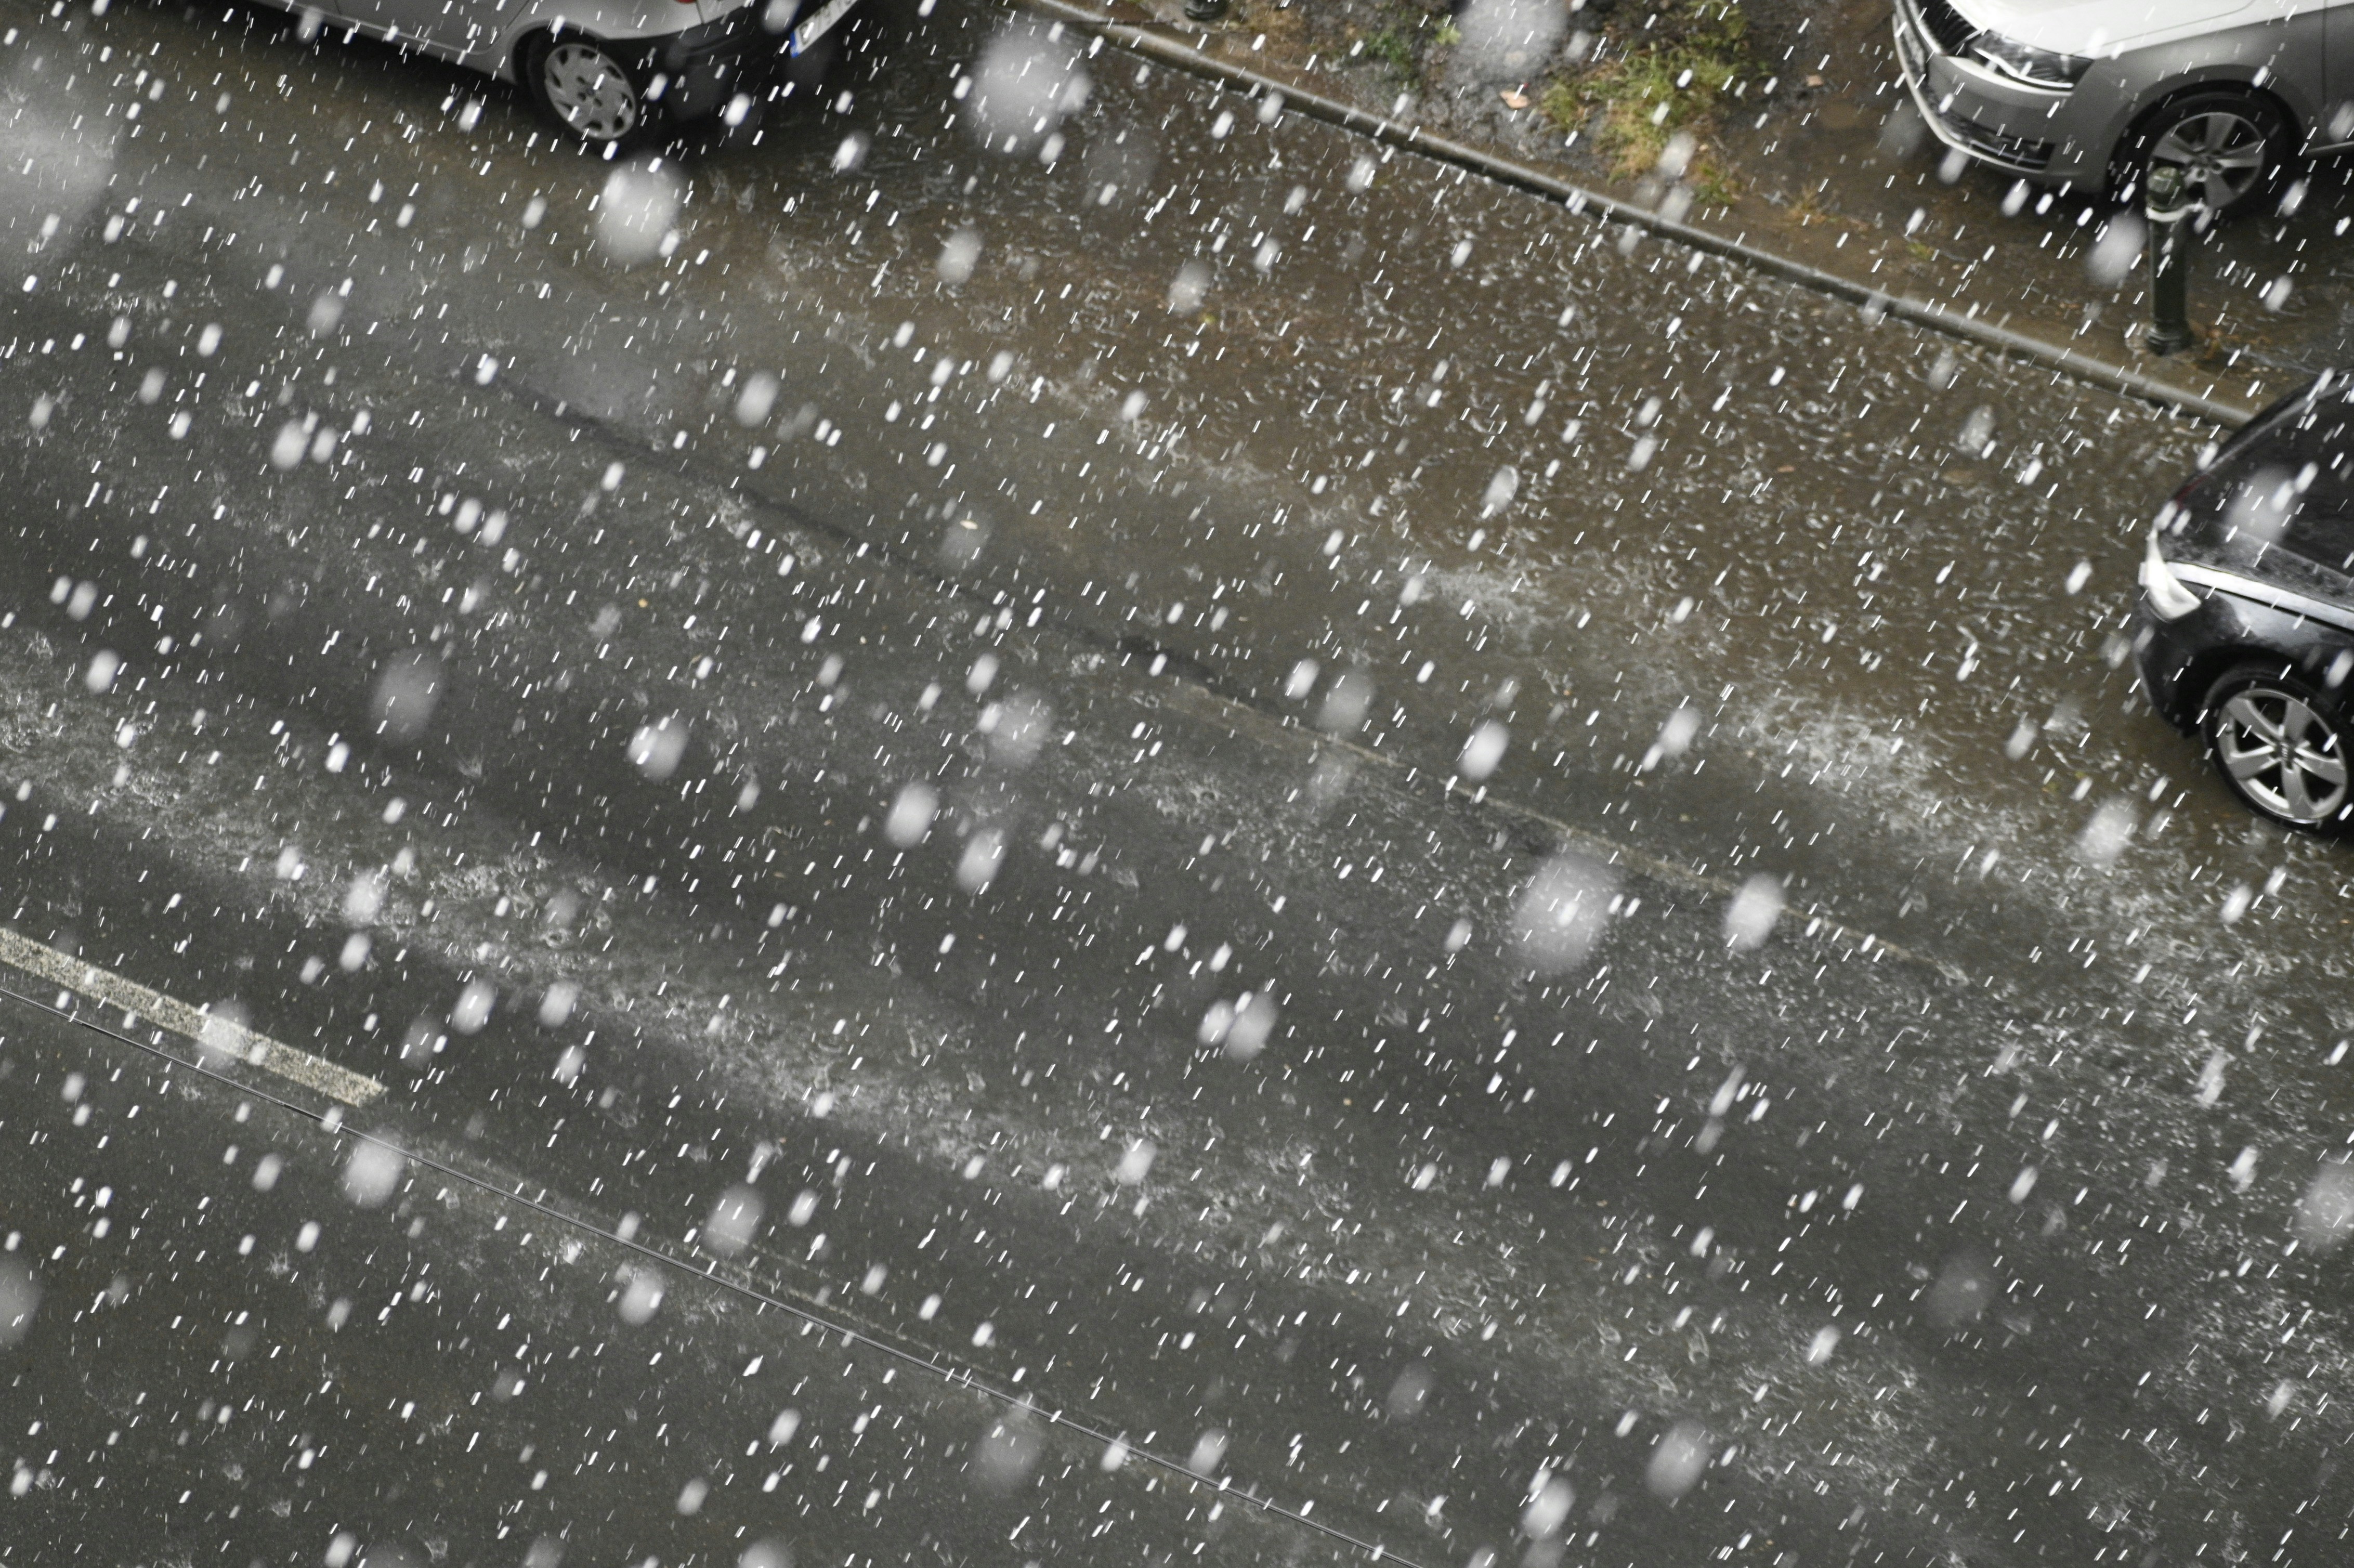
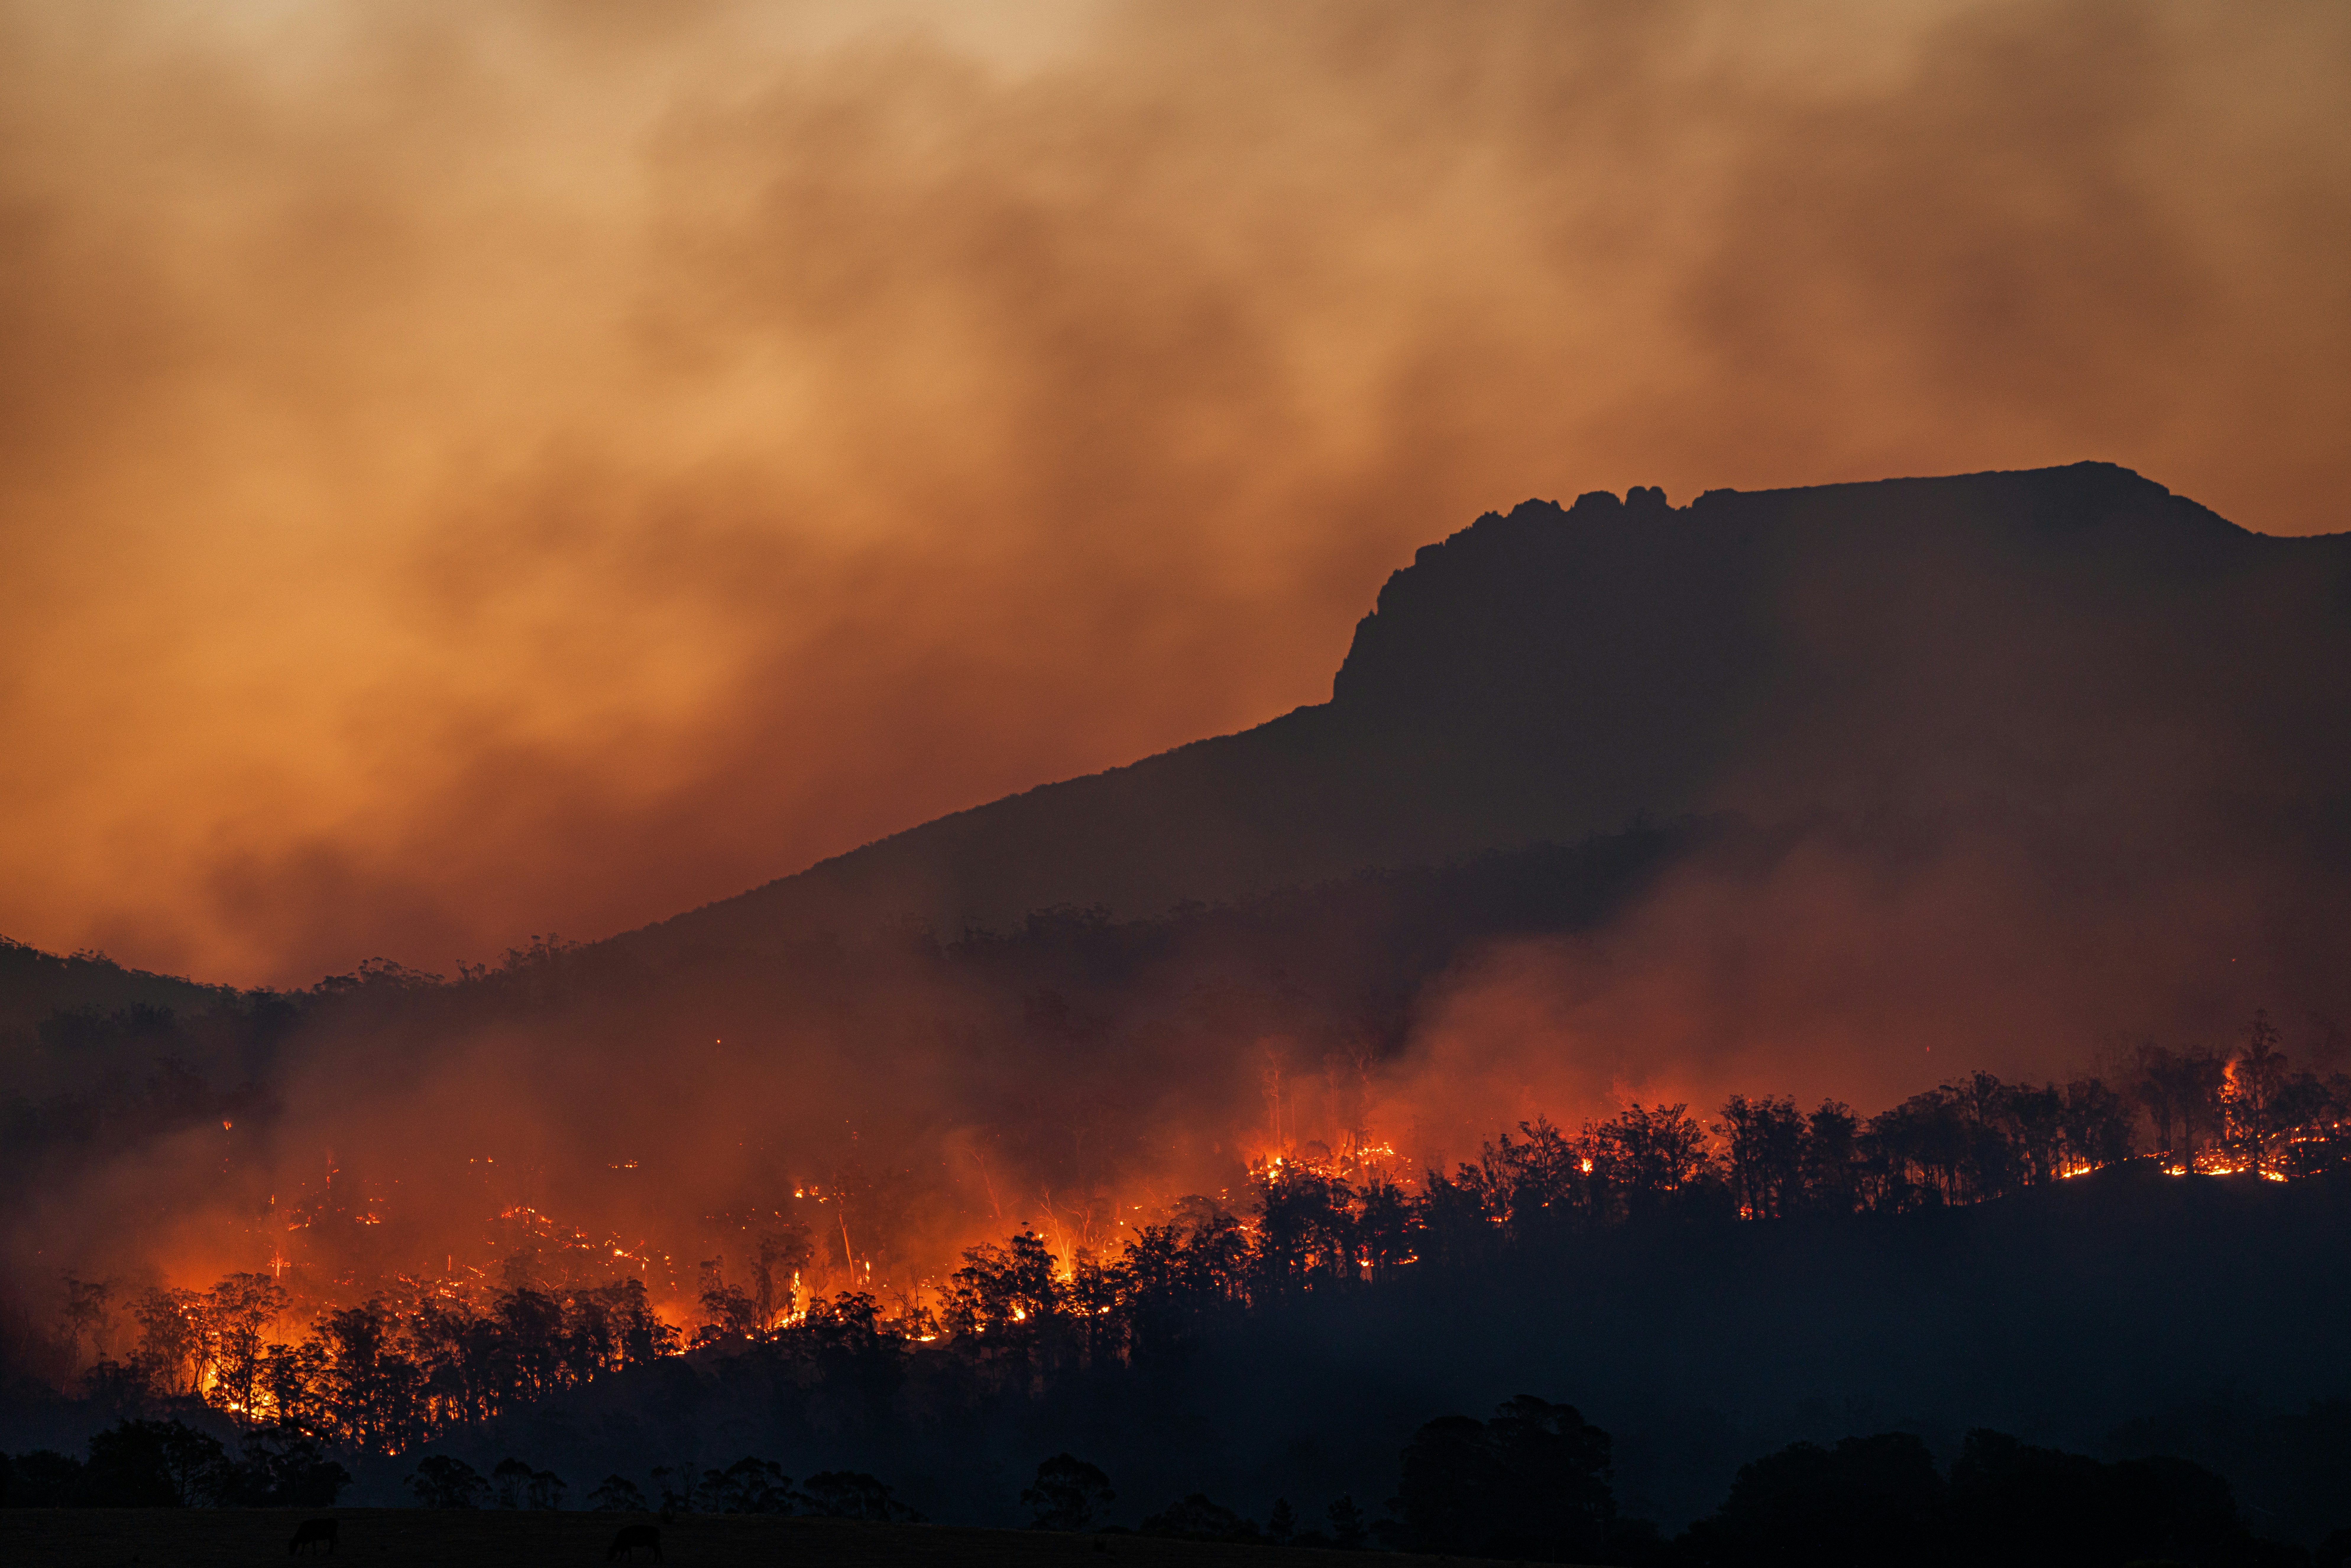
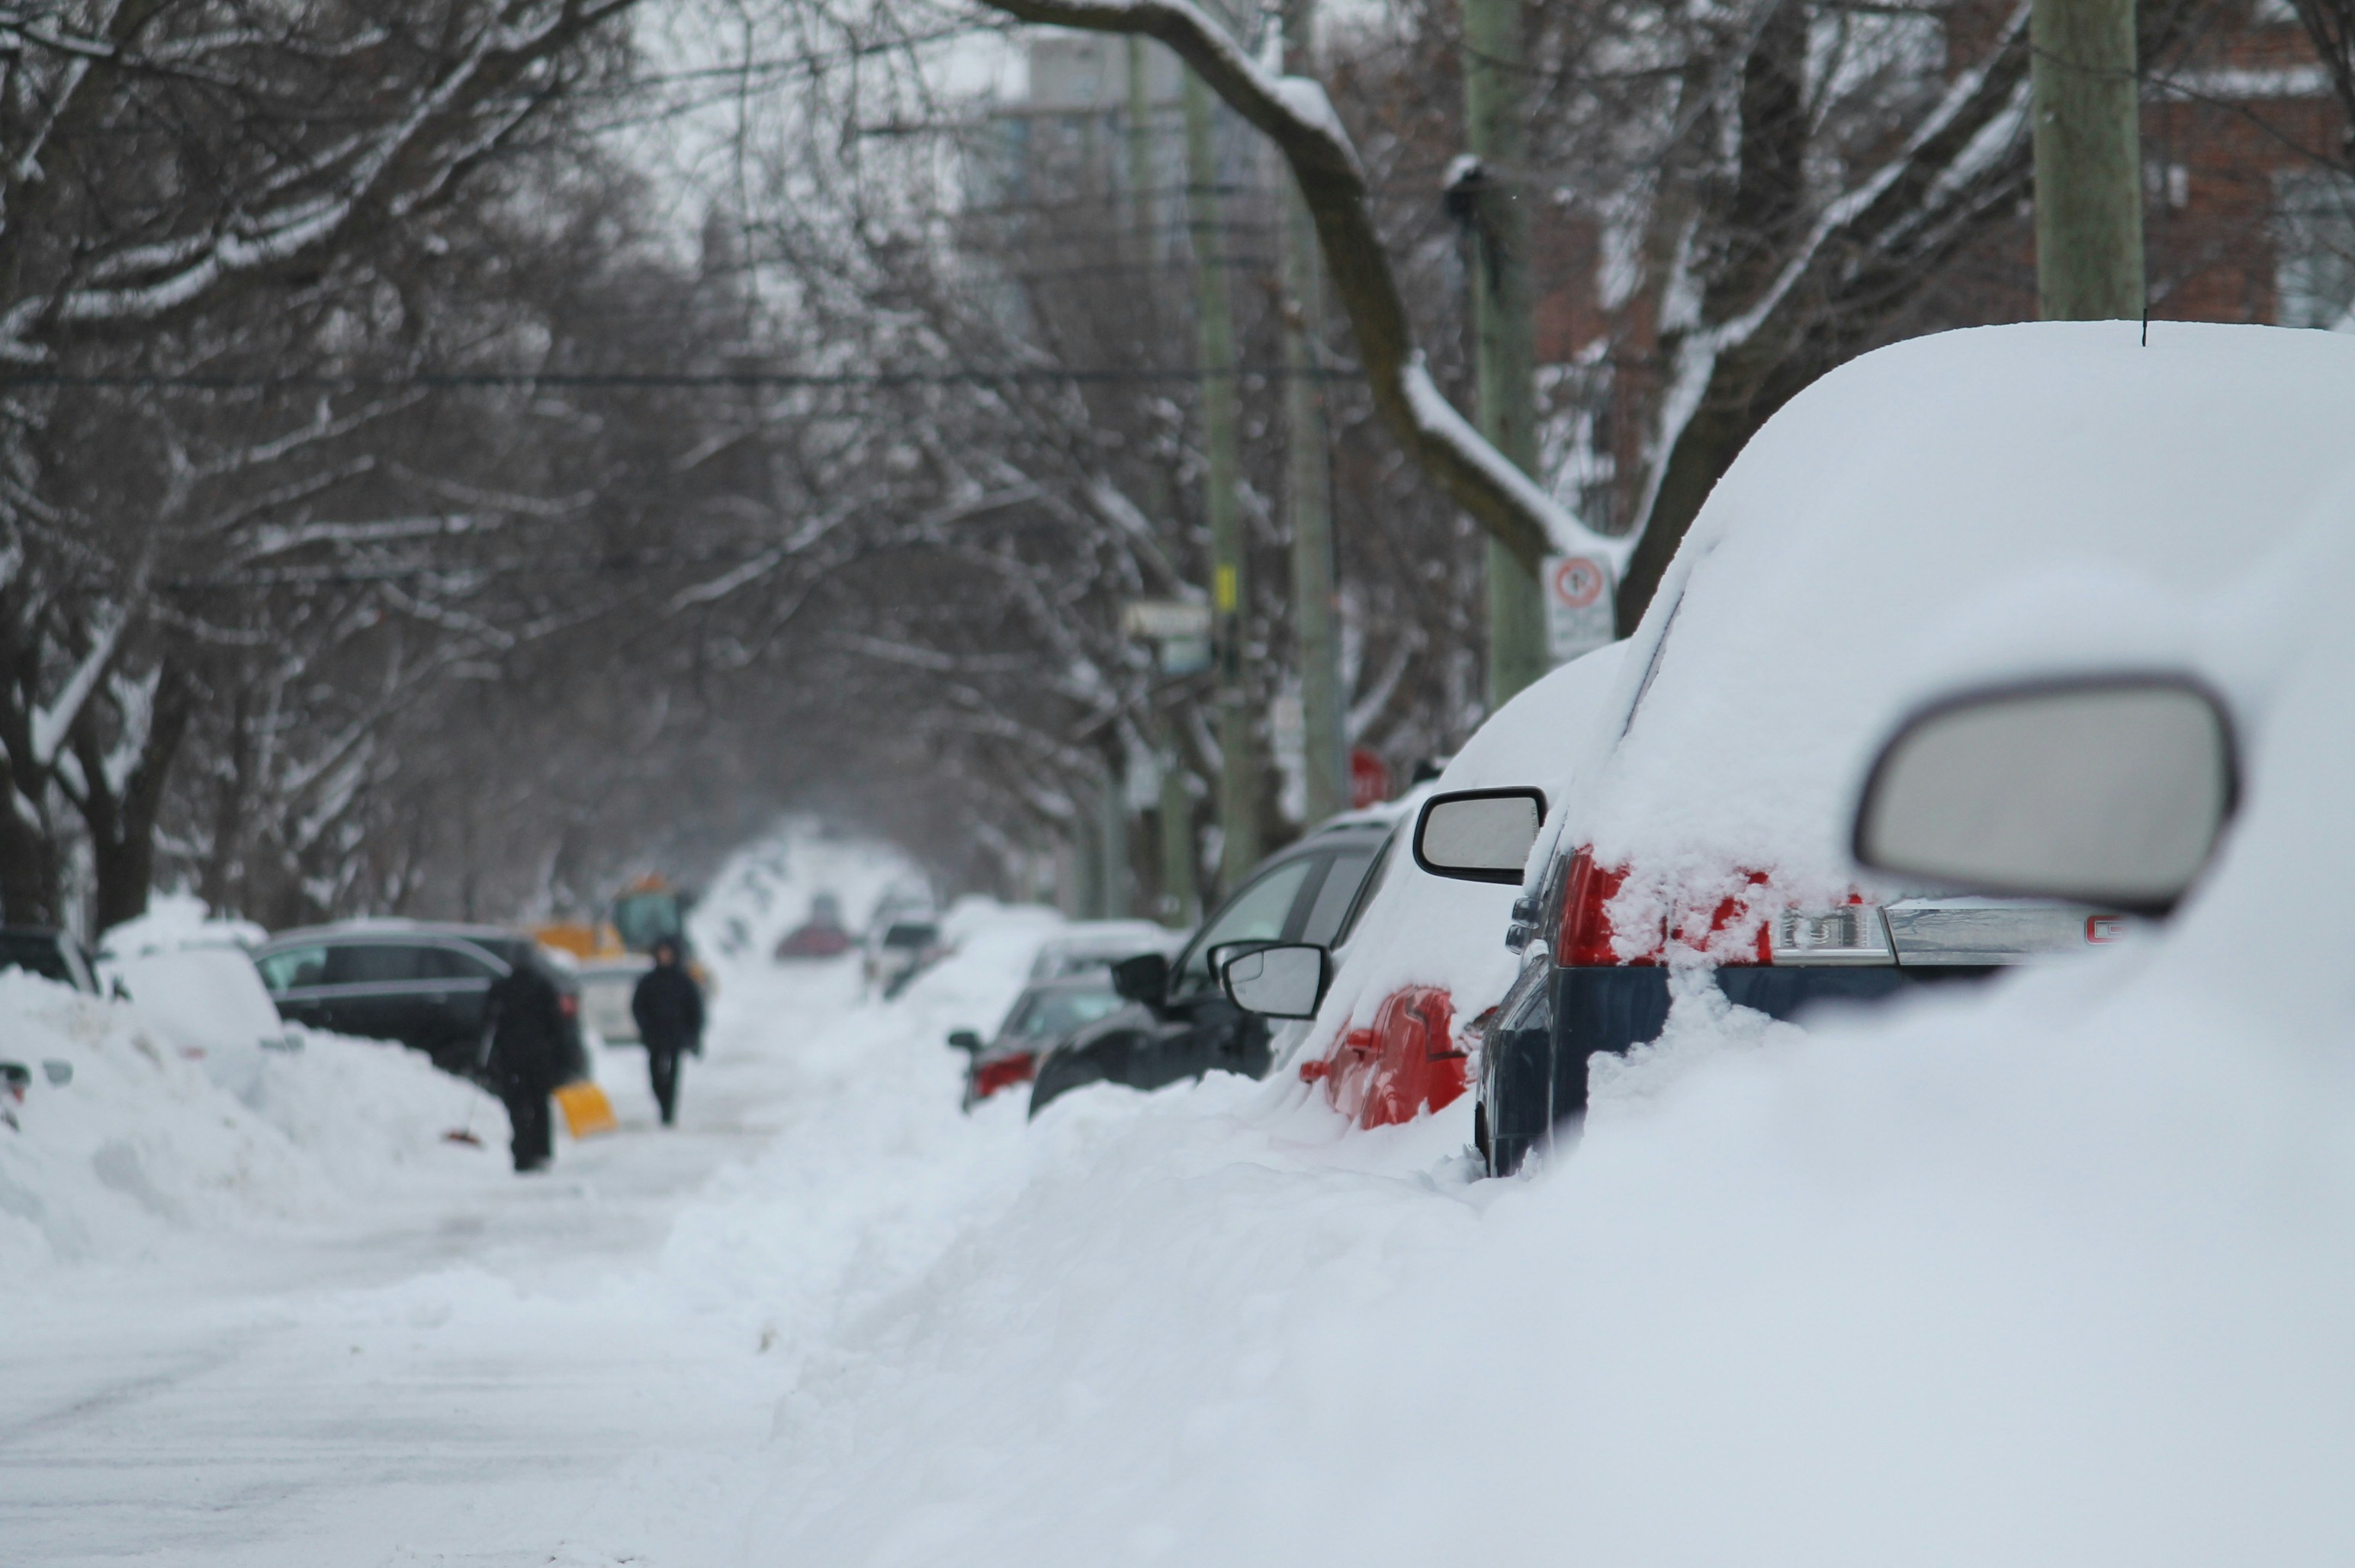
These four climate threats were selected based on Canadian insured loss history. Together they account for the majority of property catastrophe losses across Canada.
03
The Regional Peril Lens
Regional Cluster Weights — Catastrophe Exposure Emerges From the Arithmetic.
The Regional Peril Lens is now a weighting layer, not an override. Each FSA is scored with an AHP weight set derived from its region's own catastrophe-loss history, plus a published non-compensatory term that lets a single catastrophe-corridor peril lift the composite. Critical is reached through the arithmetic alone — no post-hoc province trigger.
Five regional clusters
National weights treat a Calgary hail FSA and a Montréal ice FSA identically. Instead, every FSA is assigned to one of five clusters — Prairie (AB/SK/MB), Pacific (BC), Central (ON/QC), Atlantic, North — each carrying its own AHP weight set decomposed from that region's share of 2005–2022 Canadian insured catastrophe losses. Prairie weights tilt toward wildfire and hail; Central toward flood and winter; Atlantic toward winter. Every cluster matrix has Consistency Ratio CR < 0.10. Weights are shrunk 50% toward the national set to keep overall calibration stable.
The non-compensatory term
SAW = Σ cluster_weight[peril] × peril_score
cat_max = max(peril_score for the cluster's catastrophe-driver perils)
composite = (1−λ)·SAW + λ·cat_max if cat_max ≥ 3.0 (λ = 0.45)
composite = SAW otherwise
cat_max = max(peril_score for the cluster's catastrophe-driver perils)
composite = (1−λ)·SAW + λ·cat_max if cat_max ≥ 3.0 (λ = 0.45)
composite = SAW otherwise
The
max() operator is non-compensatory: only a cluster's documented catastrophe perils (regional loss share ≥ 15%) can enter it, and only above a 3.0 gate. A single catastrophe-corridor peril lifts the composite without a province trigger; low-risk FSAs are untouched.
Worked illustration — T9H (Fort McMurray, AB)
Cluster: Prairie · Wildfire 4.000 (max, a Prairie catastrophe driver) · SAW = 2.671
cat_max = 4.000 ≥ 3.0 → composite = 0.55·2.671 + 0.45·4.000 = 3.1734
Percentile-anchored zone: Elevated — reached through arithmetic, no override.
cat_max = 4.000 ≥ 3.0 → composite = 0.55·2.671 + 0.45·4.000 = 3.1734
Percentile-anchored zone: Elevated — reached through arithmetic, no override.
Composite zones are percentile-anchored to the national distribution (Low ≤40th · Moderate 40–80th · Elevated 80–95th · High · Critical ≥3.4), giving 662 / 674 / 249 / 68 / 14 FSAs respectively (Task 2.4, June 2026; zone cuts re-derived July 2026). The 14 Critical FSAs include Manitoba/Saskatchewan prairie multi-peril (12 FSAs, wildfire- and hail-dominant) and Ontario/Quebec flood corridors (2 FSAs) — and T2P (Calgary NW) via the documented hail-Critical eligibility rule (hail_score = 4.0, 86 ICHD events). Critical is reached through genuine composite arithmetic and a data-driven corridor rule; the binary province-trigger override has been fully retired. Verified against live
ca_composite_risk_scores (2026-07).
04
The Data
Built From Canadian Government Data — With Honest Coverage Disclosure.
Authoritative datasets sourced directly from Canadian federal and provincial agencies, processed geographically across all 1,667 postal code areas. Hover any source to see the dataset detail.
Flood data coverage. ~304 FSAs have floodplain geometry from four sources: AB FHIP, TRCA regulated areas, Metro Vancouver floodplains, and Quebec BDZI (added June 2026, 174 FSAs). Of these, 53 have sufficient coverage to drive the flood score directly (HIGH band); 251 have partial geometry below the score-determining threshold (PARTIAL band). The remaining 1,363 of 1,667 FSAs score entirely on the urban-vulnerability proxy (pre-1980 housing age as a stormwater and sewer backup indicator) — coverage gap, not low risk. Scores will be revised upward as national floodplain data is ingested. NRCan national flood COG is a Phase 0 Data Priority P1 item on the roadmap.
Federal — Environment and Climate Change Canada
Severe Weather & Climate Station Records
Two datasets from Canada's national weather
observation network. Integrated Canadian Hail
Database v1.1 (2005–2024, Zenodo) powers hail
scoring — 8,457 point observations from
ECCC-affiliated stations and trained observers
mapped to FSA boundaries. Thirty-year
climate normals power winter storm scoring —
freezing rain days and ice storm frequency
across Canada's populated corridors.
ECCC
Environment and Climate
Change Canada
Open Government Licence — Canada

Statistics Canada
Federal — Statistics Canada
FSA Boundaries & Housing Age
2021 National Census — FSA digital boundary file and dwelling construction decade by postal code. Used to map urban flood vulnerability across all Canadian postal areas.
Flood vulnerability proxy
All 1,667 Canadian FSAs

Provincial — Conservation Authority
Floodplain Mapping — Greater Toronto
Regulated floodplain polygons along the Don, Humber, and Rouge River watersheds. Spatially intersected with FSA boundaries to determine flood zone coverage per postal area.
Greater Toronto Area (L-prefix FSAs)

Government of Alberta
Provincial — Government of Alberta
Flood Hazard Identification Program
FHIP floodway and flood fringe polygons mapped along major Alberta river systems. Provides authoritative flood zone boundaries for Calgary and surrounding FSAs.
Flood hazard zones · Tier A
Alberta (T-prefix FSAs)

Regional — Metro Vancouver
Fraser River Floodplain Mapping
Floodplain polygons covering the Fraser River delta and low-lying coastal areas across Metro Vancouver. Critical for assessing flood exposure in BC's lower mainland FSAs.
Metro Vancouver (V-prefix FSAs)

Natural Resources Canada
Federal — Natural Resources Canada
Canadian Wildland Fire Information System
National Fire Database (NFDB) — large fire perimeter polygons ≥200 ha. 16,340 fires, 1972–2024. Used to calculate historical wildfire density per FSA across all provinces.
Wildfire history · Tier A
All provinces and territories · 1972–2024

Insurance Bureau of Canada · CatIQ
Insurance Bureau of Canada · CatIQ
Canadian Catastrophe Loss Data
17-year insured loss proportions (2005–2022) used to validate that peril weights reflect actual Canadian insurance market losses — not modelled assumptions.
Weight calibration only
National · Not a spatial input
05
Backtest — Six Canadian Catastrophe Events
How did the model perform against real events?
Six benchmark Canadian insured-loss events. For each we score the primary FSA(s) using post-renormalization (v2) scores and assess whether the model would have flagged the risk before the event. Scores are on the 1.0–4.0 IW scale. Composite risk zones are percentile-anchored to the national distribution: Low ≤40th · Moderate 40–80th · Elevated 80–95th · High p95–3.40 · Critical ≥3.40 (criterion-anchored). Critical is reached through the regional-cluster composite arithmetic alone — there is no post-arithmetic province override. A backtest with zero misses reads as fabricated — the misses below are the mechanism.
Event 01
Southern Alberta Flood — June 2013
~$1.7–1.9B insured loss (IBC) · Bow and Elbow river corridor, High River
HIT T2A
MISS T0L
T2A — Calgary Bow/Elbow
Flood: 3.497 | Composite: 2.096 Moderate
Flood score correctly High (3.497). Composite stays Moderate because flood weight is 38% — single-peril model limitation. A pre-2013 underwriter using IntelliWhere would have seen High flood exposure in T2A.
Flood score correctly High (3.497). Composite stays Moderate because flood weight is 38% — single-peril model limitation. A pre-2013 underwriter using IntelliWhere would have seen High flood exposure in T2A.
T0L — High River / Foothills
Flood: 1.034 | Composite: 2.357 Moderate
Honest miss. High River (T0L) scores near-floor flood because AB FHIP data covers urban Calgary corridors but not the Highwood River floodplain. Unmapped area reads as low-risk — the exact failure mode Phase 1 Task 1.3 addresses with a data-confidence flag.
Honest miss. High River (T0L) scores near-floor flood because AB FHIP data covers urban Calgary corridors but not the Highwood River floodplain. Unmapped area reads as low-risk — the exact failure mode Phase 1 Task 1.3 addresses with a data-confidence flag.
Event 02
Fort McMurray Wildfire — May 2016
$3.58B insured loss (CatIQ nominal final) · Canada's costliest insured disaster to date
HIT T9H T9J T9K
T9H / T9J / T9K — Fort McMurray
Wildfire: 4.000 (maximum) for all three FSAs. Cluster composite: T9H 3.1734 Elevated · T9J 3.031 Elevated · T9K 3.013 Elevated.
Under national-only weights wildfire's 23% share leaves these FSAs Moderate. The Prairie cluster weighting plus the non-compensatory term lift them to Elevated through the arithmetic — wildfire is a Prairie catastrophe driver, so its 4.0 score enters the composite directly. No post-hoc override is applied.
Under national-only weights wildfire's 23% share leaves these FSAs Moderate. The Prairie cluster weighting plus the non-compensatory term lift them to Elevated through the arithmetic — wildfire is a Prairie catastrophe driver, so its 4.0 score enters the composite directly. No post-hoc override is applied.
Event 03
Eastern Ice Storm — January 1998
~$1.4B+ insured loss (IBC) · Montérégie QC + Eastern Ontario corridor
HIT QC + ON
J3B/J3G — Montérégie QC
J3B — Winter: 3.034 (Elevated) · Flood: 4.000 (proxy-only) · Composite: 2.503 Elevated
J3G — Winter: 3.034 (Elevated) · Flood: 3.895 (proxy-only) · Composite: 2.769 Elevated
Hit on WINTER: ECCC 30-yr freezing rain and ice storm normals are high for the Montérégie corridor — the winter score correctly flags the 1998 ice storm zone. Note: J3B/J3G flood scores reflect the housing-age proxy only (no floodplain geometry exists for QC in the current model). An ice storm is not a flood event; the flood score is not the relevant signal here.
J3G — Winter: 3.034 (Elevated) · Flood: 3.895 (proxy-only) · Composite: 2.769 Elevated
Hit on WINTER: ECCC 30-yr freezing rain and ice storm normals are high for the Montérégie corridor — the winter score correctly flags the 1998 ice storm zone. Note: J3B/J3G flood scores reflect the housing-age proxy only (no floodplain geometry exists for QC in the current model). An ice storm is not a flood event; the flood score is not the relevant signal here.
K0A / K0B — Eastern Ontario
K0A — Hail: 3.336 · Winter: 3.307 · Composite: 2.655 Elevated
K0B — Hail: 3.546 · Winter: 3.230 · Composite: 2.730 Elevated
Both correctly Elevated. Winter score (3.2–3.3) reflects ECCC freezing-rain climatology for this corridor.
K0B — Hail: 3.546 · Winter: 3.230 · Composite: 2.730 Elevated
Both correctly Elevated. Winter score (3.2–3.3) reflects ECCC freezing-rain climatology for this corridor.
Event 04
BC Atmospheric River Floods — November 2021
~$0.5B+ insured / ~$9B+ total damages · Abbotsford, Merritt, Princeton
MISS V2S
MISS V3G
PARTIAL V0K
V2S / V3G — Abbotsford
V2S — Flood: 1.894 · Composite: 1.552 Low
V3G — Flood: 1.571 · Composite: 1.368 Low
Honest miss. The 2021 Sumas Prairie flood inundated some of Canada's most productive agricultural land. IntelliWhere has no BC lowland floodplain polygons — the Fraser Valley is entirely unscored for flood. Unmapped = reads as low-risk. Remediation: NRCan national flood COG + BC Ministry floodplain mapping (Phase 0 Data Priority P1/P2).
V3G — Flood: 1.571 · Composite: 1.368 Low
Honest miss. The 2021 Sumas Prairie flood inundated some of Canada's most productive agricultural land. IntelliWhere has no BC lowland floodplain polygons — the Fraser Valley is entirely unscored for flood. Unmapped = reads as low-risk. Remediation: NRCan national flood COG + BC Ministry floodplain mapping (Phase 0 Data Priority P1/P2).
V0K — Merritt
Wildfire: 3.871 · Flood: 1.530 · Composite: 2.507 Elevated
Partial. IntelliWhere correctly flags Merritt as Elevated because of wildfire exposure — Merritt sits in BC's Interior wildfire corridor. The flood component of the 2021 event (Nicola River) is missed for the same data-coverage reason as Abbotsford.
Partial. IntelliWhere correctly flags Merritt as Elevated because of wildfire exposure — Merritt sits in BC's Interior wildfire corridor. The flood component of the 2021 event (Nicola River) is missed for the same data-coverage reason as Abbotsford.
Event 05
Calgary Hailstorm — August 2024
$3.25B insured loss (CatIQ final) · Costliest hail event in Canadian history
HIT T2P
MISS T1Y
T2P — Calgary NW (hail corridor)
Hail: 4.000 (maximum) · 86 events, 23.0mm mean diameter · Arithmetic composite: 3.1055 Elevated · Zone: Critical (hail-Critical corridor rule)
T2P's arithmetic composite (3.1055) falls in the Elevated band; single-peril hail dominance is compensated by lower flood/wildfire/winter scores. The documented hail-Critical eligibility rule (Task 2.4) escalates T2P to Critical: Calgary-CMA prefix (T2*), hail_score = 4.0, 86 ICHD events ≥ 50-event threshold. The Phase 1.4 percentile remap (HP99=2.8188→4.0) placed T2P at hail saturation — the strongest single-peril hail signal in the national dataset — providing the evidence base for the rule. See Section 6 of the methodology note.
T2P's arithmetic composite (3.1055) falls in the Elevated band; single-peril hail dominance is compensated by lower flood/wildfire/winter scores. The documented hail-Critical eligibility rule (Task 2.4) escalates T2P to Critical: Calgary-CMA prefix (T2*), hail_score = 4.0, 86 ICHD events ≥ 50-event threshold. The Phase 1.4 percentile remap (HP99=2.8188→4.0) placed T2P at hail saturation — the strongest single-peril hail signal in the national dataset — providing the evidence base for the rule. See Section 6 of the methodology note.
T1Y — Calgary NE (storm epicenter)
Hail: 1.000 (floor) · Composite: 1.651 Low
Honest miss. ICHD v1.1 contains zero observer reports within T1Y's 15.82 km² boundary for 2005–2024. The Aug 2024 storm track targeted this FSA specifically. Zero events reflects observer coverage gaps in newer NE Calgary suburban development, not absence of hail risk. Remediation: Phase 1 Task 1.4 (population-density offset) + Northern Hail Project integration.
Honest miss. ICHD v1.1 contains zero observer reports within T1Y's 15.82 km² boundary for 2005–2024. The Aug 2024 storm track targeted this FSA specifically. Zero events reflects observer coverage gaps in newer NE Calgary suburban development, not absence of hail risk. Remediation: Phase 1 Task 1.4 (population-density offset) + Northern Hail Project integration.
Event 06
Jasper Wildfire — July 2024
~$1.2B insured loss (CatIQ) · 30% of Jasper townsite destroyed
NEAR-MISS T0E
T0E — Jasper / Upper Athabasca
Wildfire: 3.561 · Hail: 3.549 · Composite: 2.375 Moderate.
T0E's wildfire score (3.561) reflects CWFIS burn history and FWI climatology in the upper Athabasca corridor; 93 ICHD hail events also make it multi-hazard. However, the compensatory AHP weighting pulls the composite to 2.375 — T0E's low flood and winter scores offset the strong wildfire and hail signals. Known limitation: compensatory weighting is the correct default for portfolio aggregation but understates single-peril-dominant tail events like this one. The retired province-trigger Lens previously escalated T0E to Critical; that override is now removed because it was non-reproducible from data alone. T0E's honest zone is Moderate; correctly identifying it as Critical requires a single-peril concentration rule analogous to the Calgary hail rule — a documented Phase 2 work item. T0E's burn history includes the Jasper 2024 fire (CWFIS data through 2024 database vintage).
T0E's wildfire score (3.561) reflects CWFIS burn history and FWI climatology in the upper Athabasca corridor; 93 ICHD hail events also make it multi-hazard. However, the compensatory AHP weighting pulls the composite to 2.375 — T0E's low flood and winter scores offset the strong wildfire and hail signals. Known limitation: compensatory weighting is the correct default for portfolio aggregation but understates single-peril-dominant tail events like this one. The retired province-trigger Lens previously escalated T0E to Critical; that override is now removed because it was non-reproducible from data alone. T0E's honest zone is Moderate; correctly identifying it as Critical requires a single-peril concentration rule analogous to the Calgary hail rule — a documented Phase 2 work item. T0E's burn history includes the Jasper 2024 fire (CWFIS data through 2024 database vintage).
Summary
| Event | FSA | v2 Zone | With Lens | Assessment |
|---|---|---|---|---|
| 2013 AB Flood | T2A | Moderate | Moderate | Hit — flood exposure flagged |
| 2013 AB Flood | T0L | Moderate | Moderate | Miss — flood data gap (FHIP covers urban AB only) |
| 2016 Fort McMurray | T9H/T9J/T9K | Moderate | Critical | Hit — wildfire at max; Lens correctly escalates |
| 1998 Ice Storm | J3B/J3G/K0A/K0B | Elevated | Elevated | Hit — winter corridor correctly Elevated |
| 2021 BC Floods | V2S/V3G | Low | Low | Miss — no BC lowland floodplain data (P1 remediation) |
| 2024 Calgary Hail | T2P | Elevated | Elevated | Hit — hail corridor at max (86 events, 23mm) |
| 2024 Calgary Hail | T1Y | Low | Low | Miss — ICHD observer coverage gap in NE Calgary |
| 2024 Jasper Wildfire | T0E | Moderate | Critical | Hit — wildfire Elevated; Lens escalates to Critical |
Scores are v2 (post-renormalization). Renormalization maps national p1→1.0 and p99→4.0 per peril, ensuring full 1–4 range use. Validated against 17 years of IBC/CatIQ insured loss data (national aggregate, all lines). Note: all-lines aggregate may understate hail's property-specific loss share — flagged for refinement with property-only CatIQ data. This note will be updated as additional flood data is ingested.
Known limitation — hail severity in sparse-observation FSAs (partially addressed, Phase 1.4). Of 1,667 FSAs, approximately 1,130 (68%) have zero recorded hail events in ICHD v1.1 (2005–2024) and score at the 1.0 floor — correctly indicating no observation-supported hail exposure rather than substituting a national average. For FSAs that do have observations, Phase 1.4 (June 2026) introduced credibility weighting: the diameter component's 0.55 weight is earned linearly over the first 10 events, preventing a single large-diameter report from driving the score on par with a sustained 86-event corridor. An FSA with 0–3 events still reaches only a diameter-capped floor score. Closing the observation gap itself (radar-derived hail swaths, ICLR/ECCC gridded hail climatology) remains a Phase 2 data work item.
06
The Team
Ryan Nguyen
B.Eng Geomatics Engineering — York University (Lassonde) · Founder, IntelliWhere
Ryan Nguyen is a Geomatics Engineer with field experience on Ontario's largest transit infrastructure projects: Ontario Line, Eglinton Crosstown West, Hurontario LRT, GO Expansion. IntelliWhere applies the same spatial precision used in billion-dollar infrastructure to Canadian property climate risk.
View LinkedIn